UTILITY DATA SOLVED
Utility data you can actually use
Get accurate, validated utility data with no fuss — delivered to you in the way you use it.


UTILITY DATA SOLVED
Get accurate, validated utility data with no fuss — delivered to you in the way you use it.
Easy and clean utility data — without the hassles
Validated, standardized utility data is not easy to come by, yet it’s critical to supporting financial decisions for building improvements, maintenance budgets and proving value over time.
Whitepaper
This whitepaper discusses five of the biggest internal costs of “Do It Yourself” data entry, and outlines how data service solutions can help you maximize efficiency.
Download NowThousands of deregulated utility companies send their own unique statements each month. Each speaks its own language and uses its own format. Data entry is time-consuming and error prone, not to mention the whole process can take weeks and lead to high-value employee burnout.
EnergyPrint’s utility data services are the “easy button” for building professionals who want to Find, Track & Prove energy savings. Our team of data analysts works directly with thousands of utility providers to gather, standardize, validate and interpret utility bill data — and then delivers it to you in a way that works for you.
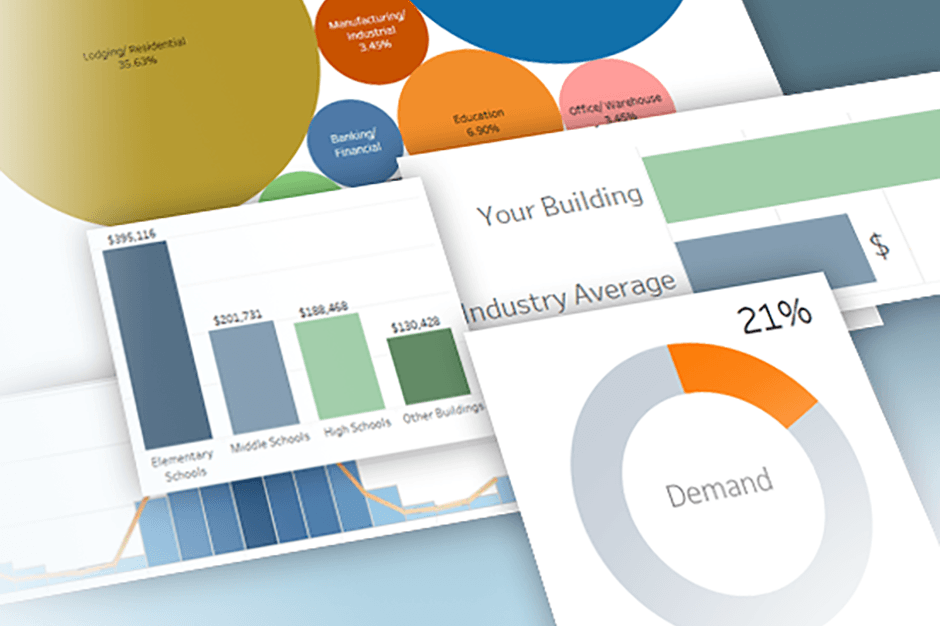
Whether it’s our Utility Dashboard, Insights Architect custom reporting, or data export services, we specialize in making utility data useful by depicting it in ways that are clear, actionable and result in bottom line savings.
The result? You get current, relevant and accurate utility data without hassle that you can use to analyze, benchmark and find opportunities to improve building performance.
"Utility bills are complicated. A lot of professionals don’t understand what all the numbers mean. I was one of them. Partnering with EnergyPrint has helped me navigate the complexity and focus on the metrics that actually matter.”
- Eddie Dunn, Building Services Consultant
CCAC Building Solutions
HOW IT WORKS
Easy and clean utility data at your fingertips. The process is simple.
Building owner or property manager authorizes data collection.
EnergyPrint gathers data directly from the utility company.
EnergyPrint collects 24+ months of utility bill history and continuously updates data monthly.
EnergyPrint connects utility data with ENERGY STAR Portfolio Manager® and exports ratings seamlessly.
Want to know more? Here are the details of how we gather insights that help you Find, Track & Prove energy savings for buildings.
Gather your data
We collect data directly from utilities. In three simple steps, we’ll “onboard” your building using one utility bill copy and a signed authorization. There are no connections to make and no equipment to install. Then, we’ll collect 24+ months of bill history to set benchmarks, and continuously update the data monthly to keep it current and relevant.

Validate your data
We aggregate and standardize the data — translating it into one common language so you can visualize cost, consumption and carbon metrics across your portfolio. Our cloud-based Utility Dashboard allows you to drill into specific properties to see deeper energy performance intelligence. Create benchmarks based on regions, property type, square footage and more.

Deliver your data
We’ll export the data to your proprietary systems or you can use our Utility Dashboard to help you visualize the data and identify opportunities. Want help with your ENERGY STAR score? We connect your data with ENERGY STAR Portfolio Manager® and export ratings back seamlessly. Need reports? Our Insights Architect reporting service delivers customized analysis tools and professional reports for your business metrics.
You’ll find plenty of building energy management systems, data software platforms, spreadsheet templates and DIY options for collecting utility data — none combine the analytics, software and manpower of EnergyPrint’s data services to easily deliver building performance insights each month.

Data from any utility
We deal with the lack of standards that makes utility information so difficult — eliminating the hassles and headaches of tracking down non-standardized data across thousands of utilities. We’ll work with any utility, regardless of the process it takes to get the data.

Actionable insight
Each month, new data points — including benchmarks against similar buildings in our proprietary database — spark insights that help you find savings opportunities or prove cost avoidance. We’ll also include your building’s ENERGY STAR score.

Visualize your data
Whether its via customized Data Export, our cloud-based Utility Dashboard or leveraging our Insights Architect reporting service, we will deliver your building’s utility data to you in ways that are simple, useful and intuitive.
OUR SOLUTIONS
See how you can improve building value and performance with relevant and accurate data, benchmarking and reporting services from EnergyPrint.
Gain insights with relevant, accurate utility data
Learn MoreDiscover opportunities to reduce and manage energy costs
Learn More
Tell your energy savings story with Insights Architect
Learn More
Identify leads and opportunities and become a trusted energy advisor
Learn More
Establish credibility with data-driven benchmarking reports
Learn More
Prove energy savings and ROI with quality utility data
Learn More
Get utility data delivered to you any way you want it
Learn MoreStreamline the ENERGY STAR certification process
Learn More