EnergyPrint is continuously developing new tools for contractors and building and property managers. These new features in the EnergyPrint application will help you convince various stakeholders that tracking their energy or taking on a particular building upgrade will be worth it.
 Lightning Estimates
With Lightning Estimates, you can backfill a meter’s history with only one bill’s data. This allows you to quickly get a property to appear in the EnergyPrint Utility Dashboard with stats based on its projected usage. Rather than using a dummy or sample building’s data, you rely on a small bit of this particular property’s utility information to estimate cost, usage, trends, and potential savings.
Go to Onboarding > Self-Enter Data in the Dashboard to get started.

How does it work? Using the cost and usage per day of a single bill, we extrapolate and build a bill back to the start of the billing month, creating a single complete month-normalized entry. Using a prediction algorithm based on comparable nearby properties, we are able to build monthly bill predictions for up to two years of history, depending on available data.
What is it for? If you are trying to sell a building owner or other decision-maker on utility bill tracking, you can show them how the EnergyPrint Utility Dashboard and its analytics work using their very own building’s data—but you’ll only need a single utility bill to create the history necessary to populate all of our features.
 Projected Savings
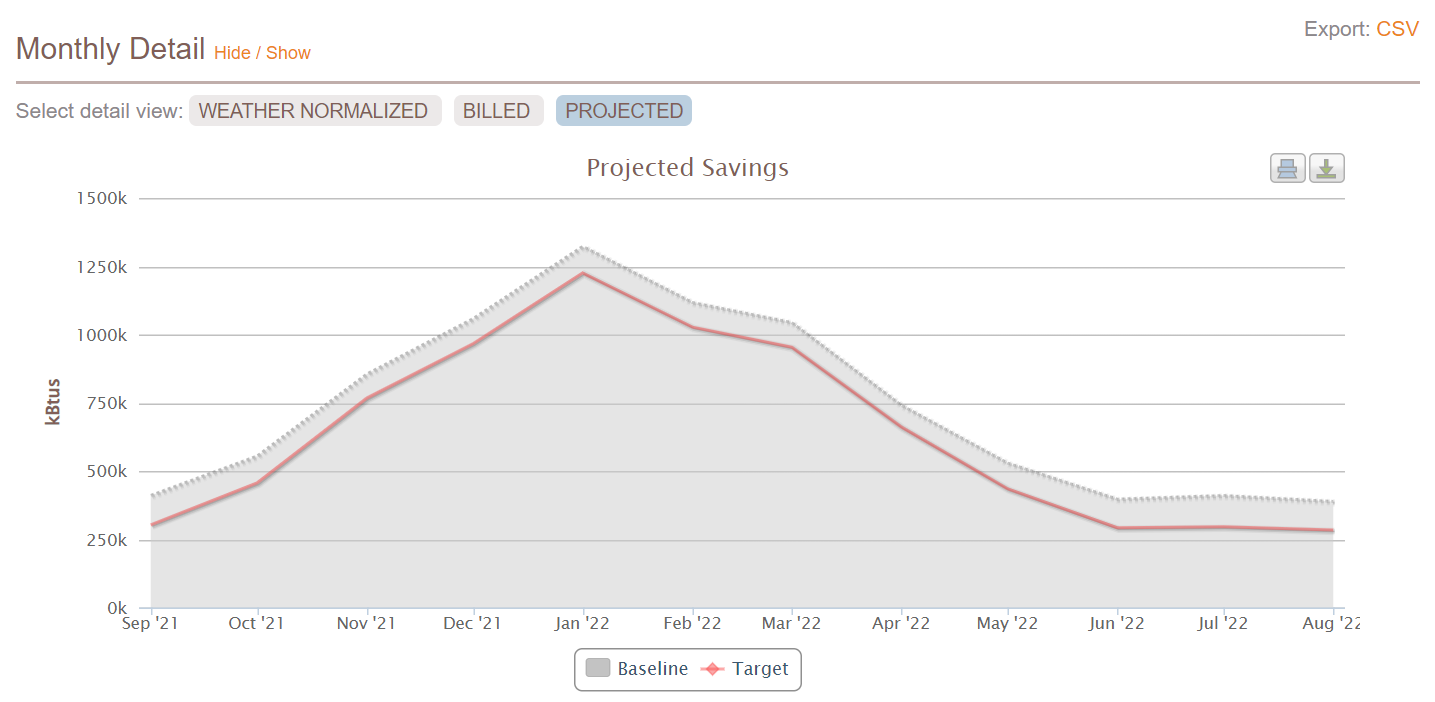
Projected Savings allow users to put a number to the predicted savings of an improvement project, and then track the actual ongoing data to see whether or not that projected goal is achieved. In the Utility Dashboard, under the Cost Avoidance tab, you can select a previous building project—or enter a new one—and you can choose the Projected overlay for your monthly detail graph.
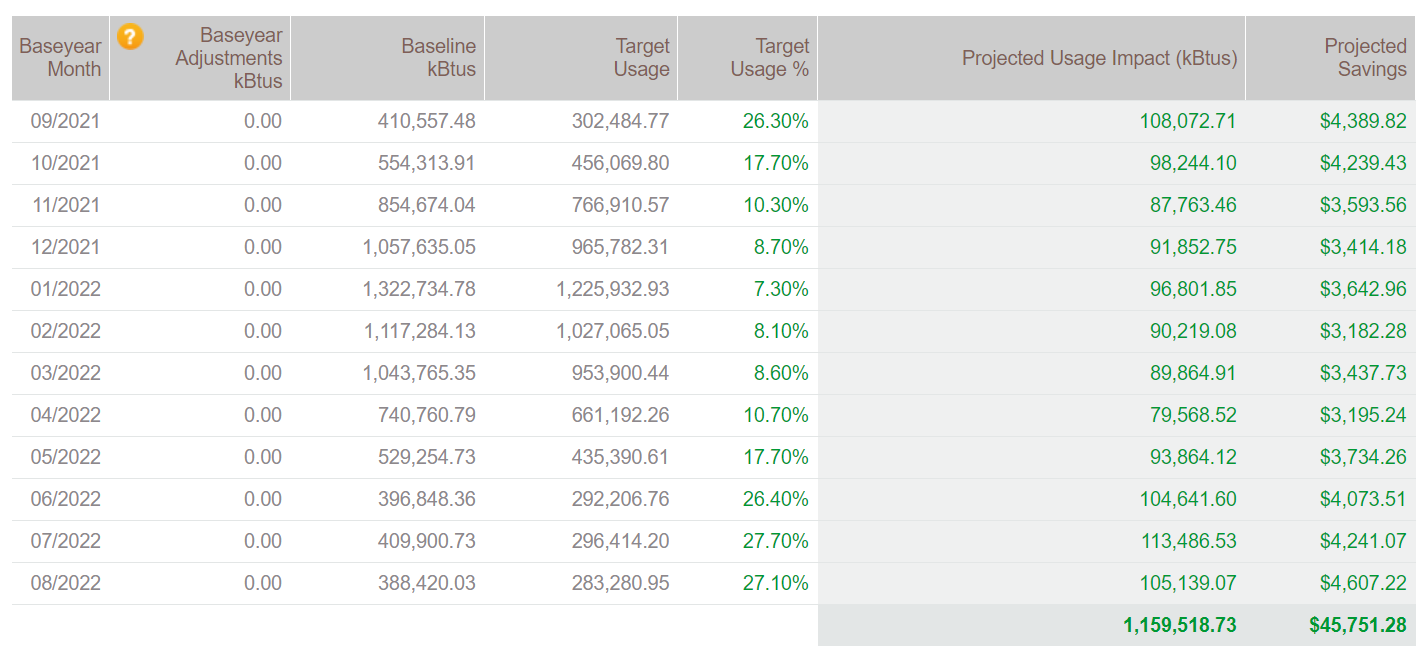
For example, if one of EnergyPrint’s contractor partners estimates that a particular improvement can reduce a building’s energy consumption at a certain percentage (e.g., “This more efficient chiller will reduce your electrical usage by 15%”), they can configure a project called “New Chiller” and set the target line to reflect 15% savings on electricity. After they save it, they will have an attractive chart to show and a table full of green projected numbers (see above) to show prospective clients.
Then over time, they can prove to the client whether or not the improvement lived up to expectations and what the ultimate ROI was. These projected savings will give a detailed overview to persuade decision-makers to invest in these proposed projects. Continuing to use the Cost Avoidance tab and reports, contractors can easily visually validate their efficiency claims, leading to increased customer trust and more projects getting approved.
Get Started
Are you ready to take your energy tracking to the next level and easily determine ROI? Make sure you’re taking full advantage of EnergyPrint’s newest enhancements. Contact us today if you need help getting started or watch CTO Michael Harms walk you through the process:

