One of the most overlooked aspects of an energy reduction project is proving whether or not it produced the intended cost and consumption savings. This tutorial video walks you through how to use Cost Avoidance in EnergyPrint’s Utility Dashboard so you can easily measure and prove ROI for your building improvements. (NOTE: This tutorial is also available in the Videos tab when you login to the Utility Dashboard)
Using Cost Avoidance
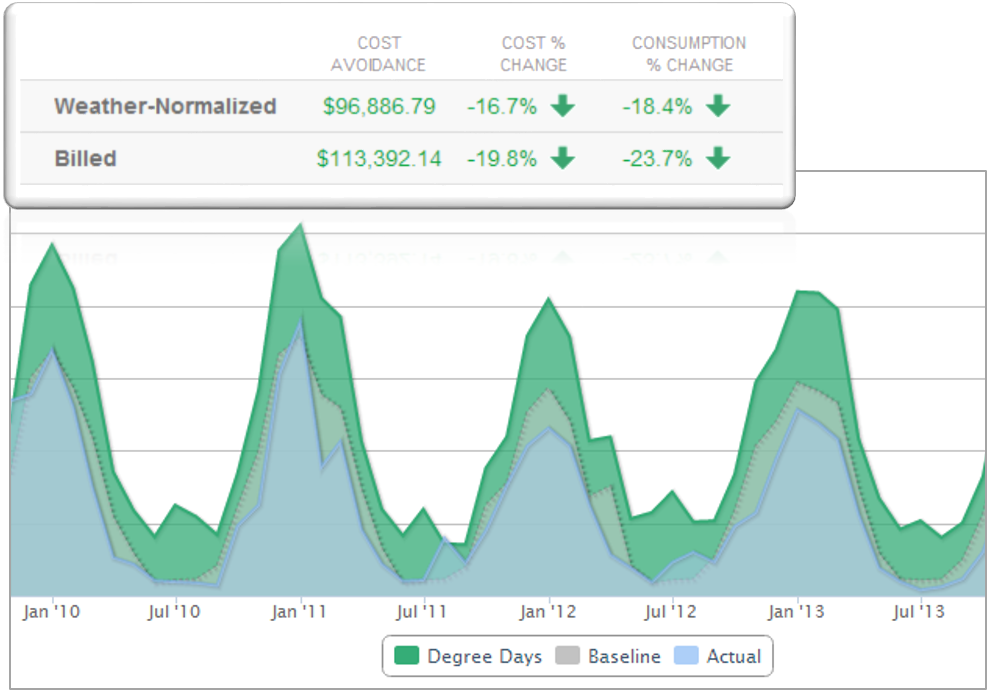
The Cost Avoidance tab in the Utility Dashboard visualizes energy savings based on an adjustable 12-month baseline period. Compliant with ASHRE 14 and IPMVP Whole Building Option C Measurement and Verification (M&V) protocols, the Cost Avoidance feature tracks and compares both billed and weather normalized cumulative energy performance. The result is a consistent and credible illustration proving how much cost and consumption has been avoided.
 The dotted gray line in the measurement period represents what you would expect your building to consume based on your baseline. The solid blue line shows your actual energy consumption. The gap between these two lines represents your total avoided consumption. Your total cost avoidance is displayed above the graph, while the bottom of the page provides a monthly breakdown.
Weather Normalized Cost Avoidance
EnergyPrint’s Weather Normalized Cost Avoidance is a premium feature that allows you to see the avoided costs regardless of weather—illustrating the true value of energy savings projects. This service is valuable for assessment of changes in performance related to specific energy conservation measures – behavioral and/or projects intended to reduce energy cost and consumption. This is also an excellent tool for Measurement and Verification (M&V) and performance contracts.
What Are the Benefits?
- Prove the value of energy conservation measures and projects
- Track progress against corporate savings goals
- Maximize Return on Investment (ROI)
- Simple Measurement and Verification (M&V)
- Compliant with IPMVP (Option C) and ASHRAE 14 standards
- Add adjustments for more accurate measurement
- Simple to understand charts, graphs and reports
- See your true energy performance with respect to changes in local weather
Want to learn more about EnergyPrint’s Cost Avoidance? Contact Us.

