
Energy Benchmarking for Compliance, Data, and Building Performance

Chicago

Benchmarking for Compliance, Data, and Performance

Energy benchmarking has become a standard requirement for commercial and other large buildings across the United States. What started as a transparency initiative is now a core operational responsibility for building owners and managers. 

Benchmarking is an ongoing process that supports compliance, cost control, and long-term performance improvement. Understanding how it works and what’s required can help you ensure compliance the first time and avoid the challenging resubmission process.

What is energy benchmarking?

At its core, energy benchmarking is the practice of tracking a building’s energy and water use over time and reporting that data through EPA’s ENERGY STAR Portfolio Manager. Most local and state benchmarking ordinances require owners to submit at least 12 consecutive months of utility data on an annual basis.

This data creates a baseline for understanding how a building performs compared to itself year over year and against similar buildings nationwide. Without that baseline, it is nearly impossible to validate whether energy projects, operational changes, or building investments are actually reducing costs.

Benchmarking turns utility bills into usable data that enables informed decision making around energy conservation and cost saving efforts.

Why Benchmarking Requirements Keep Expanding

Governments continue to expand benchmarking requirements for a simple reason: buildings account for roughly 40% of total energy consumption in the United States. Benchmarking programs give cities and states visibility into energy usage patterns while giving owners a structured way to identify inefficiencies and reduce waste.

For building owners, compliance is mandatory. But the data collected can also support broader goals such as operating expense reduction, asset value preservation, sustainability reporting, and tenant transparency.

Navigating Benchmarking Compliance

Benchmarking sounds straightforward on paper, but execution is where many companies struggle.

Common issues include:

  • Delays in obtaining complete and accurate utility data
  • Properties being rejected due to data gaps or quality checker errors
  • Missed deadlines because of follow-up delays
  • Rejected submissions that require appeals or resubmission
  • Managing different requirements across multiple jurisdictions

Benchmarking is not necessarily limited to a single submission. It often involves multiple rounds of validation, corrections, and communication with utility companies and jurisdictions. This follow-up burden is one of the biggest pain points for companies we work with, especially when their portfolios span multiple cities or states.

Why Rejections Happen and What to Do

Rejections are common and are usually tied to incomplete data, incorrect property setup, or failed data quality checks in Portfolio Manager. Without a clear process, rejections can create operational challenges, as well as compliance risk.

Appeals and resubmissions take time, and missing deadlines can result in penalties or public non-compliance listings.

In some cases, buildings may qualify for temporary exemptions or extensions, but those require formal appeals and documentation. This is where a managed benchmarking approach becomes critical.

Turning Benchmarking Into Proof of ROI

Beyond compliance, benchmarking provides the foundation for proving a positive return on investment for energy initiatives. Once a baseline is established, owners can measure performance using year-over-year comparisons or project-specific analysis.

When combined with tools like cost avoidance and weather normalization, benchmarking data can show whether savings are real, sustained, and tied to specific actions. This removes guesswork and allows stakeholders to evaluate projects based on actual utility cost outcomes, not estimates.

If savings do not show up on the utility bill, they are not savings. Benchmarking makes that clear.

How EnergyPrint Simplifies the Process

EnergyPrint manages the full benchmarking lifecycle, not just the submission itself.

Our benchmarking solution includes:

  • Collecting and validating utility data directly from providers
  • Setting up and maintaining Portfolio Manager properties correctly
  • Running and resolving data quality checks
  • Submitting reports to required city and state portals
  • Managing follow-up, rejections, appeals, and resubmissions
  • Keeping portfolios compliant year after year as requirements change

For building owners and managers, this removes the operational burden while ensuring accuracy and consistency across properties.

Benchmarking is an Ongoing Operational Process

Benchmarking is not a single deadline you need to meet. It’s an ongoing operational requirement that, when handled correctly, provides insight into building performance and energy costs over time.

As more jurisdictions adopt benchmarking and disclosure laws, having a repeatable, reliable process matters. The organizations that treat benchmarking as a managed solution rather than an annual obligation are the ones that stay compliant, reduce risk, and extract real value from their data.

EnergyPrint helps building owners do exactly that, across Minnesota and nationwide. To understand your local benchmarking requirements and ensure your properties are fully compliant, schedule a free audit.

What Building Owners Need to Know About Minnesota’s Expanded Benchmarking Requirements in 2026

Minnesota State Capitol building in winter.

June 1, 2025 was the first deadline for Minnesota state benchmarking requirements, which covered buildings 100,000 square feet and larger. This year, more buildings are covered by the law and must report their energy usage.

While several Minnesota cities previously required energy use data benchmarking disclosures from municipal and other large buildings (including St. Paul, Minneapolis, and Edina), the State of Minnesota now operates a Large Building Energy Benchmarking Program.

Under this program, owners of large buildings must upload utility data into their ENERGY STAR® Portfolio Manager and file an annual report using the state’s Building Portal.

Where the Program Applies

The statewide benchmarking requirement covers buildings 50,000 square feet and larger in these areas:

  • Anoka, Carver, Dakota, Hennepin, Ramsey, Scott, and Washington counties
  • The cities of Duluth, Rochester, and St. Cloud

Reporting Requirements & Deadlines

There are two compliance classes and deadlines covered under this program:

  • Class 1 Properties (100,000+ sq ft): First required to report energy use by June 1, 2025
  • Class 2 Properties (50,000–99,999 sq ft): First required to report energy use by June 1, 2026

If your building meets these thresholds, you must file annually by June 1 going forward.

How to Ensure Benchmarking Compliance in Minnesota

To comply, building owners need to:

  • Track 12 full months of energy data with ENERGY STAR’s Portfolio Manager
  • Run the Data Quality Checker and correct any issues
  • Connect and share properties with the State of Minnesota
  • Submit the annual Energy Reporting Form through the Minnesota Benchmarking Portal

Benchmarking Experience You Can Trust

Whether you’re facing reporting deadlines for the first time or managing compliance across multiple buildings and jurisdictions, EnergyPrint handles the entire process for you. It’s not just Minnesota, we can help you navigate benchmarking requirements and submissions nationwide.

If we already handle your city benchmarking submissions, we’ll also help you comply with state requirements. And if you’re brand new to the benchmarking process, reach out to your CSM or contact us to get started.

7 Ways ESG Creates Value and Accelerates Growth

ESG creates value and equity for companies that are focused on sustainability, decarbonization, and social responsibility.

ESG, or Environmental, Social, and Governance, encompasses a set of environmental standards that companies can adopt to reduce emissions and prove their energy-saving improvements to investors.

Companies that prioritize ESG disclosures can set themselves apart from their competition and can help accelerate their long-term growth and operating efficiencies.

How does ESG create value?

ESG disclosures offer companies many benefits. Companies with a strong corporate culture and social equity outperform the market and attract investors, delivering a higher valuation.

A solid ESG strategy creates competitive advantage, lowers investment risk, and delivers societal benefits that matter to investors and employees. Publishing a sustainable business plan and reporting on progress will attract investor dollars, avoid problems with government compliance, and more.

1. Attract Investor Capital

Having a long-term strategic emissions plan is a necessity if you’re looking to attract investors who favor companies that set ESG goals and disclose improvements. A growing segment of investors screen companies according to their energy policies and commitment to net zero operations.

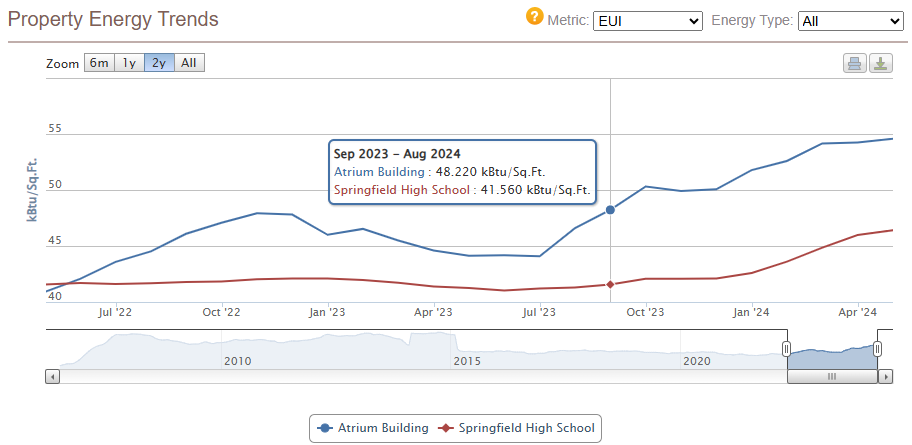
Companies today need to be able to prove their energy usage and improvement efforts. This includes benchmarking, tracking changes over time, and providing real data that can demonstrate a positive ROI.

Investors are more likely to buy into a company that can present accurate data on the impact of previous energy improvements, along with a plan for future decarbonization efforts.

Investors will believe in your vision and trust your projections if you can tell your story with actionable data.

2. Get Ahead of Future Legal and Regulatory Guidelines

While there are currently no standard, comprehensive ESG reporting regulations across the entire United States, the regulatory environment for climate and sustainability disclosures has seen significant developments.

The U.S. Securities and Exchange Commission (SEC) adopted its final rule on the Enhancement and Standardization of Climate-Related Disclosures for Investors in March 2024. This rule was a landmark effort to standardize disclosures.

ESG planning and compliance with the SEC allows you to be prepared now so you aren’t faced with red-tape issues in the future. A sustainable business model put in place today can help you avoid future operating disruptions that can occur when reacting to changes in energy availability, industry regulations, and investor demands.

Accurate reporting is a crucial part of achieving future government compliance. Ensure that you’re prepared with audit-ready data now by incorporating ESG software into your current technology stack.

3. Higher Productivity and Lower Operating Costs

Investors are attracted by candid, accurate ESG reporting for a good reason. Companies with a strong commitment to improving their ESG score produce higher earnings and less investment risk.

When a company is focused on its emission output, it will naturally discover, optimize, and reduce energy consumption. This will result in higher efficiency and lower operating costs.

With operations being optimized, employee pride results in a more productive and efficient workforce.

4. Establish Your Business as a Sustainable Company

ESG creates value for your company by establishing your business as a sustainable company. A corporate culture centered on creating a low-carbon future encourages the community to stand behind your vision and efforts.

Society as a whole is aware of industrial and commercial building impacts on the environment. Buildings emit 40% of man’s greenhouse gas emissions. The public cares about what companies are doing to minimize these impacts and will often make decisions based on a company’s sustainability.

Companies with a strong energy and carbon reduction commitment can also expect to attract and retain top talent in the workforce. Employees will be more committed and engaged knowing they are a part of a rewarding and equitable work environment.

5. Calculate ROI on Emissions Improvements

Reducing carbon emissions is not enough on its own. Companies need to be able to prove the ROI of their energy improvement upgrades with accurate data so they can financially justify the investment in their upgrades.

ESG Software can help a company create value by setting ESG benchmarks, normalizing for weather conditions, and tracking emissions improvements over time to report ROI to investors and justify additional capital that will be repaid through lower utility expenses.

In addition to determining financial ROI, proper ESG reporting can project a carbon reduction commitment to the government and public which helps build a deeper level of equity.

6. Reduced Energy Footprint

Lowering carbon emissions is a natural part of reducing your overall energy footprint.

A focus on ESG strategy not only saves your company time and money, it also supports your commitment to clean operations, decreased carbon emissions, and net zero goals.

Accurately tracking energy usage is even more important when reporting on Scopes 1, 2, and 3 carbon emissions. One building’s data can be handled on a spreadsheet; whereas a portfolio is much easier to manage with ESG software.

Once you develop ESG benchmarks, you have a clear path to create and track measurable goals to reduce your energy usage and have insight into how quickly you’re achieving these goals.

7. Establish Your Business as an Energy Leader of the Future

Innovative leaders don’t just follow business trends, they take an active role in molding the future of their industry. While carbon emission reductions and net zero goals aren’t new, official ESG standards are not yet established.

Getting started early with ESG compliance projects projects your role as a leader. It builds brand equity.

Creating a company culture that includes a focus on decarbonization that’s supported with data is stronger than one forced to play catch up with upcoming regulations.

How can ESG Software create value for your company?

ESG is an ongoing disclosure that requires you to set achievable goals and continually monitor and improve your energy efficiency. Additionally, you need to be ready at all times for an audit with accurate data you can trust.

EnergyPrint ESG software provides you with all the actionable insights you need to put your company at the forefront of net zero energy emissions and position yourself in prime position for investor buy-in. If you’re ready to make an ESG investment decision, schedule a call to learn more about EnergyPrint’s ESG data software and how it can help you prove yourself as a sustainable company to the government, investors, and the public.

From Meter to Market: Turning Utility Data into Strategic Value

EnergyPrint’s CEO Wade Smith was recently featured on the Edge of Intelligence podcast in an episode titled “From Meter to Market: How EnergyPrint Turns Utility Data into Strategic Value”.

Wade shares what it takes to accurately process over 12,000 utility invoices every month and how EnergyPrint achieves 99.45% data accuracy without increasing headcount. The conversation explores how to use smart energy analytics to deliver actionable utility insights while maintaining data integrity at every step.

The discussion also highlights the value of benchmarking how it can be powerful in enabling companies to identify opportunities for improvement by comparing their energy consumption to other similar buildings.

Whether you’re focused on operational efficiency, data integrity, saving money, or developing a smarter energy strategy, this conversation offers valuable insights into the future of utility data management.

Watch the full episode here →

Ready to see how EnergyPrint can transform your energy data into strategic value? Schedule a discovery call to learn how EnergyPrint turns utility data into strategic value.

A Message from our COO: EnergyPrint’s Commitment to ENERGY STAR and Your Data

We have received quite a few questions and inquiries about what our plans are if the federal government moves forward with its plan to shut down the ENERGY STAR program and I wanted to take a few minutes to state our current efforts and future goals regarding ENERGY STAR.

First, I wanted to address our full support for the ENERGY STAR program, which has been one of the most successful joint ventures between the government and private enterprise in the history of the United States. It has saved U.S. consumers and businesses over $500 billion in energy expenses since 1992. With an annual expense of only $32 million, it generates an annual savings of over $40 billion, making it one of the most efficient and cost-effective programs in U.S. history. We are proud to be long-time ENERGY STAR Partners and are listed as one of the program’s Most Active Service & Product Providers.

EnergyPrint was proud to sign a recent letter from the U.S. Green Building Council lobbying for the continuation and full funding of the program. We will continue to advocate for the program as we share the same vision of trying to help consumers and business owners make responsible and forward-thinking energy decisions that can help control their energy costs on an ongoing basis. Read the whole letter and see how many of our energy-saving industry peers signed it.

Recently, we reached out to our customers to reassure them that their data is not at risk if the ENERGY STAR program is discontinued. EnergyPrint will continue to gather utility data on their behalf and store it in perpetuity—this includes ENERGY STAR scores and trends. And as cities and states with existing energy benchmarking ordinances adapt to changes on the federal level, we will help our customers submit data through ENERGY STAR Portfolio Manager (ESPM) or any other replacement reporting tool to comply with these laws.

Property Energy Trends graph comparing two properties' EUIs.
Property Energy Trends graph from the Utility Dashboard comparing two properties’ EUIs.

Thanks to customer feedback, we learned many of our customers found Energy Use Intensity (EUI) on ESPM to be an incredibly valuable metric. While we have always provided an annual snapshot of EUI for each property on our Utility Dashboard (we simply referred to it as consumption per square foot) we decided to incorporate monthly tracking of this metric for the entire property and for each utility type. We’ve added it to our Portfolio and Property Energy Trend graphs. Now, you can easily visualize your EUI over time for each building, across your entire building portfolio, and compare your buildings’ EUIs to each other.

This is the first of what we hope will be several additional dashboard improvements as we continue to listen to our customers about what they find most useful and relevant in their ESPM profiles. We also will be continuing to have conversations with state and local legislators here in the state of Minnesota to help educate them about what a resource gap shutting down the ENERGY STAR program would create for consumers, business owners, and property owners and managers.

ENERGY STAR is a vital program that we hope will continue, but EnergyPrint will remain steadfast in its advocacy and innovation so that we can continue to help our customers meet their energy goals now and into the future.

Sincerely,

Matt Gamble, Chief Operating Officer at EnergyPrint

Visualize and Benchmark Your Energy Data with Self-Entered Utility Bills

Accurate utility tracking is crucial when it comes to monitoring energy usage and savings over time.

EnergyPrint’s self-entered bill feature allows you to easily enter your building information and utility bills so you can visualize energy usage and make actionable decisions. With long-term visibility and tracking you can prove ROI on energy improvements and ensure you’re continuing to achieve positive outcomes.

The self-service utility tracking dashboard, ready to add properties.

The EnergyPrint Utility Dashboard creates calendar month-normalized data to help you view your average energy usage per square foot, see trends in long-term utility consumption, and benchmark your building against peers.

You can use this service for free for up to six meters and you’re always in control of your data.

Use utility tracking to find opportunities with the energy management dashboard.

Visualize Your Utility Data in Minutes

All you need to get started with our self-entered bill feature is a free online account and at least one utility bill.

The only information you need to provide at sign up is your name, company, and email. Once your account is created, you can start entering your building data and bill history.

After adding your buildings and inputting a few months of bills, you’ll be able to see your historical energy usage in our intuitive dashboard and start discovering trends and anomalies by building and across your portfolio. Self-entered bills list the utility tracking and usage on a specific electric meter.

In addition to being able to visualize your utility usage over time, you’ll also have a secure repository to store all your utility bill PDFs in one place for easy access. There is no additional cost for this feature, and we will never delete your bill data. 

Energy Benchmarking and Comparisons Made Easy

Without accurate energy data and utility tracking, there’s no way to truly know how much energy you are using and saving over time. Benchmarking is the first step in tracking and proving energy reduction.

Entering up to twelve months of bill history will establish a baseline for each of your utility meters for comparison purposes. Self-entered bills allow you to create these benchmarks to measure your building’s performance against its own historical performance as well as other buildings within your portfolio.

Do you know if your buildings are doing better or worse than similar buildings?

Benchmarking your energy usage with EnergyPrint also gives you the added benefit of comparing your buildings against our database of over 6,800 buildings to see if your buildings are doing better or worse.

Property Energy Trends graph comparing the utility tracking for multiple properties in a portfolio, as well as to similar buildings using the advanced search feature.

High energy usage can add up to significant costs over time. Entering your ongoing bills each month will allow you to track your building performance going forward.

If you discover your buildings are underperforming in terms of utility consumption in comparison to other buildings with similar specs, you can take action to make energy improvements and substantially lower your long-term energy consumption.

You’re In Control of Your Energy Data with EnergyPrint

Our online portal allows you to easily add and manage your buildings, enter bills, and visualize your energy usage data. You can enter up to six meters completely free of charge, giving you insight and control over your buildings and their energy data.

The EnergyPrint Utility Dashboard

Could your company benefit from EnergyPrint’s dashboard analytics?

Try our self-entered bill feature for your home or office for free to see if it’s the right utility tracking solution for your entire building portfolio. You can upgrade your account at any time to add more meters, let us fetch and enter your bills, turn on ENERGY STAR ® integration, and to unlock advanced data analytics.

Sign up now to get started!