

EnergyPrint launches Live Demo
As you may have seen on our home page, EnergyPrint has recently made available a self-guided, live demo of the Utility Dashboard. Visitors now have the opportunity to explore the Utility Dashboard at their own pace, get an understanding of the insights that EnergyPrint provides clients, and learn from a guided tour about the features that the Dashboard offers.
Why we’re so excited about this.
Energy analysis is personal. While energy costs are something that all of our clients budget for and tackle, every single building we track in the dashboard is different – from energy performance, to goals set, and accomplishments met. The dashboard features a wealth of utility data insights, yet not every one of these insights is used every single day.
You may be facing a unique issue in your building. Perhaps you’ve noticed a spike in your year over year energy costs and want to know what this is attributed to. Maybe you’re working with an energy services provider and want a simple method to validate the effectiveness and ROI of your project. Or you could be looking to comply with an upcoming energy reporting ordinance in your city, which we saw 32 different cities mandate this past year. The truth is, the Utility Dashboard is less a tool and more a toolbox, and the new Live Demo will give you the opportunity to discover and explore the specific tool that you need at your own pace.
What’s in that toolbox?
Benchmarking Tools. Benchmark your building against itself, other buildings in your portfolio, or similar buildings across the country using the Utility Dashboard’s integration with ENERGY STAR Portfolio Manager®.
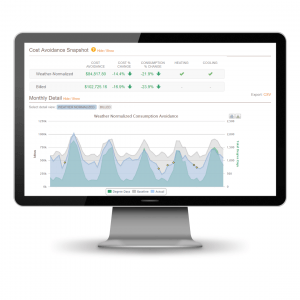
In-depth Utility Data Tracking. Track your consumption, cost, and carbon footprint across every utility you use, and see how these metrics change over time, through changes in weather, and adjustments in building usage behavior or equipment modifications.
Measurement and Verification. Use the data and tools within the Utility Dashboard to confirm the effectiveness of projects that you have implemented in your buildings, using up-to-date M&V protocols.
Compliance. Using the integration with ENERGY STAR, submit your building’s energy usage data to the proper authority to keep your building compliant with local, state, and national energy benchmarking standards.
Custom Reporting. Pull all of these insights and more into reports generated to clarify how your buildings are doing, where there are opportunities for savings, and if past improvements have paid off.
