Visualize Energy Trends With Our New Energy Observatory Feature
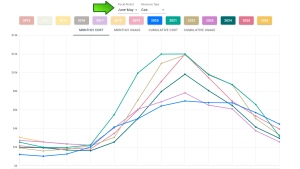
We’re excited to announce our new Energy Observatory visualization tool in the EnergyPrint Utility Dashboard. It’s an interactive and shareable way to compare costs, usage patterns, and trends year over year across your entire building portfolio.
Compare Costs and Usage Over Time
Use Energy Observatory to:
- Compare utility usage over specific years to identify changes and trends
- View electricity, natural gas, water, or all resource types
- Adjust the yearly period to match your organization’s fiscal year
- Drill down to compare an individual meter year over year
- View costs or usage by month or on a cumulative basis
This feature is already available to existing EnergyPrint customers under the Reports tab. Simply select a property and customize how you view its utility data. Each year is represented by a different color, making comparisons easy to follow.
Download and Share Your Findings
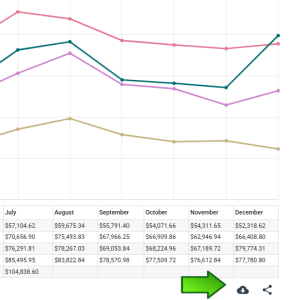
Energy Observatory visualizations can be used in reports, displayed on websites or kiosks, or shared with others to communicate utility cost and usage trends. Once you’ve created a graph, you can download and save it or generate a shareable link to send to stakeholders.
Get Started with Energy Observatory
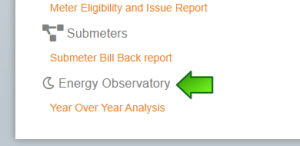
If you’re a current EnergyPrint Utility Dashboard user, all you need to do is log in and navigate to the Reports tab. Then, scroll to Energy Observatory at the bottom and select Year Over Year Analysis to start comparing and sharing your findings.
Have questions or need help? Reach out to your Customer Success Manager for assistance or schedule an intro call to get started.