Visualize and Benchmark Your Energy Data with Self-Entered Utility Bills
February 22, 2025
Accurate utility tracking is crucial when it comes to monitoring energy usage and savings over time.
EnergyPrint’s self-entered bill feature allows you to easily enter your building information and utility bills so you can visualize energy usage and make actionable decisions. With long-term visibility and tracking you can prove ROI on energy improvements and ensure you’re continuing to achieve positive outcomes.

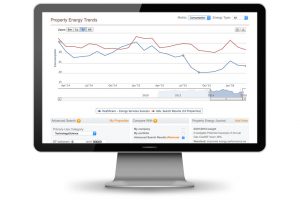
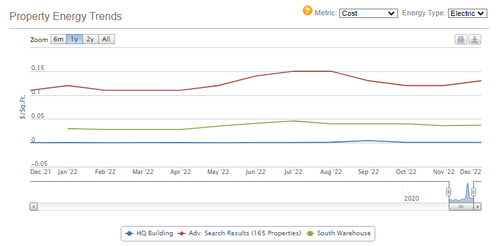
The EnergyPrint Utility Dashboard creates calendar month-normalized data to help you view your average energy usage per square foot, see trends in long-term utility consumption, and benchmark your building against peers.
You can use this service for free for up to six meters and you’re always in control of your data.

Visualize Your Utility Data in Minutes
All you need to get started with our self-entered bill feature is a free online account and at least one utility bill.
The only information you need to provide at sign up is your name, company, and email. Once your account is created, you can start entering your building data and bill history.
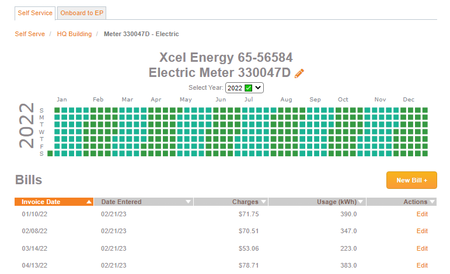
After adding your buildings and inputting a few months of bills, you’ll be able to see your historical energy usage in our intuitive dashboard and start discovering trends and anomalies by building and across your portfolio.
In addition to being able to visualize your utility usage over time, you’ll also have a secure repository to store all your utility bill PDFs in one place for easy access. There is no additional cost for this feature, and we will never delete your bill data.
Energy Benchmarking and Comparisons Made Easy
Without accurate energy data and utility tracking, there’s no way to truly know how much energy you are using and saving over time. Benchmarking is the first step in tracking and proving energy reduction.
Entering up to twelve months of bill history will establish a baseline for each of your utility meters for comparison purposes. Self-entered bills allow you to create these benchmarks to measure your building’s performance against its own historical performance as well as other buildings within your portfolio.
Do you know if your buildings are doing better or worse than similar buildings?
Benchmarking your energy usage with EnergyPrint also gives you the added benefit of comparing your buildings against our database of over 6,800 buildings to see if your buildings are doing better or worse.

High energy usage can add up to significant costs over time. Entering your ongoing bills each month will allow you to track your building performance going forward.
If you discover your buildings are underperforming in terms of utility consumption in comparison to other buildings with similar specs, you can take action to make energy improvements and substantially lower your long-term energy consumption.
You’re In Control of Your Energy Data with EnergyPrint
Our online portal allows you to easily add and manage your buildings, enter bills, and visualize your energy usage data. You can enter up to six meters completely free of charge, giving you insight and control over your buildings and their energy data.

Could your company benefit from EnergyPrint’s dashboard analytics?
Try our self-entered bill feature for your home or office for free to see if it’s the right utility tracking solution for your entire building portfolio. You can upgrade your account at any time to add more meters, let us fetch and enter your bills, turn on ENERGY STAR ® integration, and to unlock advanced data analytics.
Sign up now to get started!
EnergyPrint’s self-entered bill feature allows you to easily enter your building information and utility bills so you can visualize energy usage and make actionable decisions. With long-term visibility and tracking you can prove ROI on energy improvements and ensure you’re continuing to achieve positive outcomes.

The EnergyPrint Utility Dashboard creates calendar month-normalized data to help you view your average energy usage per square foot, see trends in long-term utility consumption, and benchmark your building against peers.
You can use this service for free for up to six meters and you’re always in control of your data.

Visualize Your Utility Data in Minutes
All you need to get started with our self-entered bill feature is a free online account and at least one utility bill.
The only information you need to provide at sign up is your name, company, and email. Once your account is created, you can start entering your building data and bill history.
After adding your buildings and inputting a few months of bills, you’ll be able to see your historical energy usage in our intuitive dashboard and start discovering trends and anomalies by building and across your portfolio.

In addition to being able to visualize your utility usage over time, you’ll also have a secure repository to store all your utility bill PDFs in one place for easy access. There is no additional cost for this feature, and we will never delete your bill data.
Energy Benchmarking and Comparisons Made Easy
Without accurate energy data and utility tracking, there’s no way to truly know how much energy you are using and saving over time. Benchmarking is the first step in tracking and proving energy reduction.
Entering up to twelve months of bill history will establish a baseline for each of your utility meters for comparison purposes. Self-entered bills allow you to create these benchmarks to measure your building’s performance against its own historical performance as well as other buildings within your portfolio.
Do you know if your buildings are doing better or worse than similar buildings?
Benchmarking your energy usage with EnergyPrint also gives you the added benefit of comparing your buildings against our database of over 6,800 buildings to see if your buildings are doing better or worse.

High energy usage can add up to significant costs over time. Entering your ongoing bills each month will allow you to track your building performance going forward.
If you discover your buildings are underperforming in terms of utility consumption in comparison to other buildings with similar specs, you can take action to make energy improvements and substantially lower your long-term energy consumption.
You’re In Control of Your Energy Data with EnergyPrint
Our online portal allows you to easily add and manage your buildings, enter bills, and visualize your energy usage data. You can enter up to six meters completely free of charge, giving you insight and control over your buildings and their energy data.

Could your company benefit from EnergyPrint’s dashboard analytics?
Try our self-entered bill feature for your home or office for free to see if it’s the right utility tracking solution for your entire building portfolio. You can upgrade your account at any time to add more meters, let us fetch and enter your bills, turn on ENERGY STAR ® integration, and to unlock advanced data analytics.
Sign up now to get started!